Jonathan Linden: You're listening to 91.9 KVCR news; I'm Jonathan Linden. We've been talking each month with Cal State San Bernardino Economics Professor Daniel McDonald to discuss economics in the Inland Empire. Daniel, can you tell us what economic indicator you have your eyes on this month?
Daniel MacDonald: The economic indicator that I'm looking at this month is mobility. So, time spent away from home doing all sorts of things outside of the home.
Jonathan Linden: And can you tell me a little bit more about that data and where you're getting it from, and what it's showing?
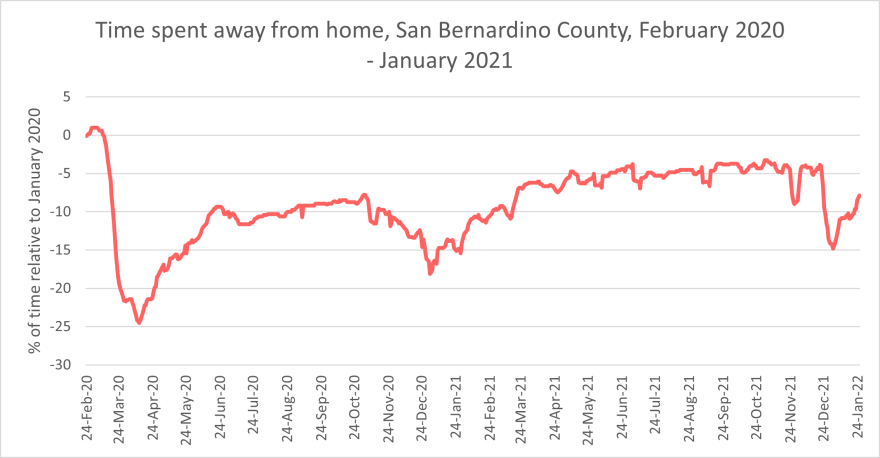
Daniel MacDonald: Sure, the data comes from Opportunity Insights, which started a whole data dashboard during the pandemic, and has just kept it going. One of the variables that they have been looking at is mobility rates, which are tracked by Google. So basically, Google tracks your mobility, using its GPS and its other app services, to track how much time you're spending away from your home. And this has been interesting to watch during the pandemic because obviously, people are spending much more time at home these days. And indeed, as soon as the pandemic hit, one of the biggest indicators that showed that people were changing their behavior was the fact that they were spending so much more time at home. And so, in the early days of the pandemic, people were spending about 50% less time away from home than they were prior to the pandemic. And more recently, we've noticed that while we are spending more and more time outside of the home, we're still spending less time than we did prior to the pandemic. So, for example, when you look at time spent at work, before the pandemic, most people commuted to work, we spent, according to the American Time Use Survey, about eight and a half hours at work either through commuting or actually at the workplace. But during the pandemic, that changed quite a bit. Not only did many people lose their jobs, and so they weren't traveling to work. But also, many people started working from home. And indeed, when you look at the data, even today, people are spending about 10 to 15% less time at work than they did prior to the pandemic.

Daniel MacDonald: The interesting thing to me about the statistic and this indicator is that Google also tracks the amount of time that we spent, not just at the workplace, but any other places that we might spend outside of the home, for example, at parks so doing sports or recreation. According to the American Time Use Survey, people that participate in those activities spend about an hour and a half doing them. But when the pandemic hit, and there were all these lockdowns, people stayed at home, and they didn't go out so much to parks and (spend) time (doing) sports and recreation. Another area in which people spend much less time outside of the home is in retail and purchasing goods and services away from home. And so that number has also dropped as well. So basically, by tracking (this) mobility data, you can see in some ways how people are participating in the economy.
Jonathan Linden: And is there specific indicators that they have for the Inland Empire region?

Daniel MacDonald: Yes, so we can actually look very specifically at what these mobility data look like in San Bernardino County. And they largely reflect national trends. There is, of course, the added benefit of being in Southern California meaning, we are able to spend more time away from the home just because of the good weather, we're able to spend more time at parks and recreation and exercising. But overall, as a county, we're still spending more time at home today than we did prior to the pandemic. And this showed up especially strongly in late December and early January when Omicron hit. So, when Omicron was really affecting a lot of households, spreading through the community, people started spending much more time indoors again. The good news is that over the last week, or week and a half or so, these mobility data are updated almost on a daily basis. We are seeing some return to normalcy. So, we're seeing people get back out; they're spending more time at shopping centers and outside again. And so, the nice thing about this indicator is that it's one of the only kind of real-time indicators that we have of, you know, understanding what's going on in the economy at this exact time. You know, when you want to learn about what's happening with the labor market or with employment or unemployment, you usually have to wait one or two months to learn that information. But with this mobility data, we can see when people are going back to work; we can see when people are getting out (and) shopping.
Jonathan Linden: Well, as usual, thank you so much, Professor MacDonald, for taking some time to join me today.
Daniel MacDonald: Thanks, Jonathan. It was a pleasure.


